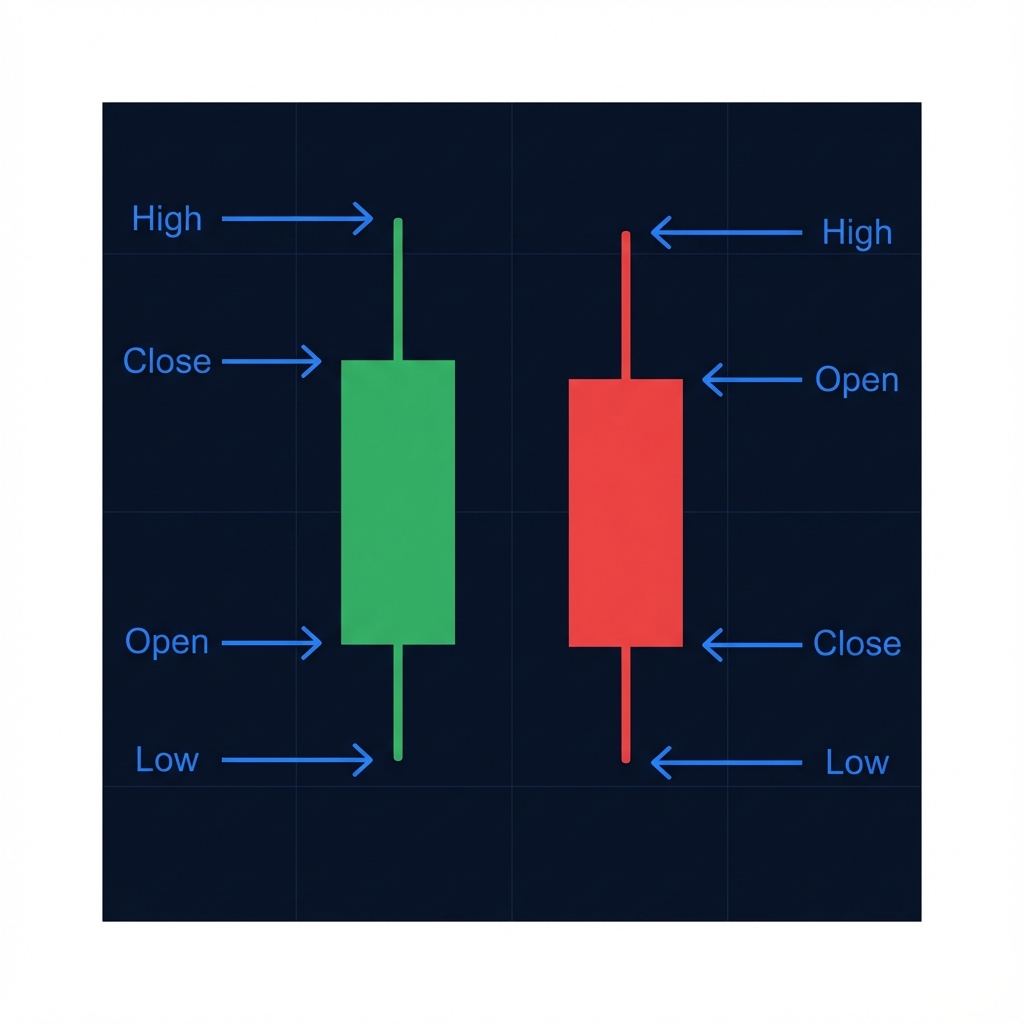
- Open: Where the price started.
- High: The peak of the session.
- Low: The bottom of the session.
- Close: Where the price ended.
The body shows conviction. The wicks show rejection and volatility.
Mastering Candlestick Analysis in Forex
Originating from 18th century Japanese rice traders, candlesticks reveal the emotion behind price action.
Understand the battle between Buyers (Bulls) and Sellers (Bears) in every timeframe.
Decoding the OHLC data.
The body shows conviction. The wicks show rejection and volatility.
Powerful signals from just one bar.
Indecision. A sign of potential reversal if found at key levels.
Bullish Reversal. Sellers pushed down, but buyers rallied back strongly.
Bearish Reversal. Buyers tried to break out, but sellers slammed the price down.
Momentum. A full body candle showing total dominance by one side.
Two-bar formations indicating momentum shifts.
When the second candle completely "eats" the previous one, it signals a massive shift in sentiment.
Red candle followed by a larger Green candle.
Green candle followed by a larger Red candle.
Complex reversal and continuation signals.
Bullish Reversal
Down trend → Indecision → Up trend.
Bearish Reversal
Up trend → Indecision → Down trend.
Strong Continuation
Three consecutive green candles marching higher.
A pattern without context is just a drawing.
Only trade reversals at key levels.
The trend is your friend. Don't fight the flow.
Higher timeframes (4H, Daily) carry more weight.